Process Flow Custom Visual
What it is, how it works and how to use it


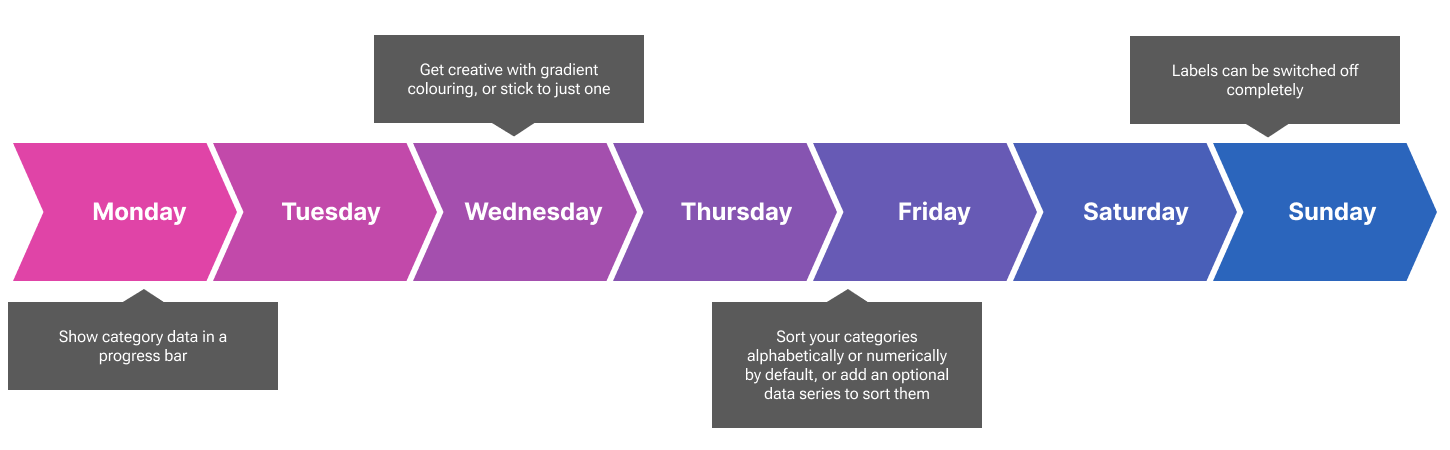
Do your category data have a natural sequence? Perhaps you want to show project phases, time, life stages, educational attainment, status, priority or size. Process Flow Diagram lets you do this in style. It takes a category data series and shows it in a series of arrows.
Make your arrows eye-catching by playing with color gradients. Just set a start and end color, and we will interpolate between them. Set the start and end to the same color to make your bar one uniform color.
By default, you can sort your arrows numerically or alphabetically, but you can add an optional data series specifically for sorting if you wish. Tooltips work as standard and you can click to filter or highlight other visuals in your report.

The Process Flow Diagram offers flexibility in design, allowing users to control the direction of the arrows. By providing a negative value in the "Indent" field within the format pane, the arrows will point to the left instead of the default rightward orientation. This feature is especially useful for creating visuals that represent backward progress or negative values in a dataset.
Users can enhance the visual representation by supplying a numeric series into the "Size By" field. This input dynamically adjusts the width of the arrows, and the tooltip automatically keeps pace by showing this number data on hover.
As with all standard Power BI visuals, the Process Flow Diagram supports full integration with highlighting and filtering functionalities. Depending on the settings in the Edit Interactions menu, the visual can either filter or highlight other visuals on the report. Additionally, it can itself be filtered or highlighted in turn. However, note that inbound highlighting is only functional when a numeric series is bound to the category data. See the demo for more.

The Process Flow Diagram offers tooltips and click to filter as standard. However, if you use Manual Override, these features are disabled, since your data series are no longer connected to your arrows.
If you need some arrows in a hurry, you can switch on the Manual Override toggle, and type the values you want in a semi-colon separated list. You can still color by interpolation.

You can drive the arrow colors by data if you provide a "Color by data" series. You provide high, medium and low values with corresponding colours, and we will interpolate the color for each category. Using this, you can create traffic light colouring for performance or risk; you can highlight exceptional results; or simply color the weekend days differently.
Arrows can also be curved instead of pointy, with greater or smaller curvature. You can remove the gap between the arrows to create a merged color effect.

Get creative! Change the gap between arrows, change the pointiness, add a border to completely revolutionise how your arrows look each time you use the visual.
Change the font: you can change the font type, the size, colour, make it bold, italic or underlined. Oh, and you can switch off the labels completely if you prefer and rely on the tooltip!